Statistics on reporting
Reports of suspected adverse reactions
An adverse reaction to the vaccine is any reaction that is harmful and unintended. Not every sign of illness that occurs in temporal connection with a vaccination is also attributable to the vaccination. If vaccines are administered to a large number of persons, the probability increases that after a vaccination complaints occur that were not triggered by the vaccination but by other causes, such as another illness occurring at the same time or shortly afterwards ("background incidence").
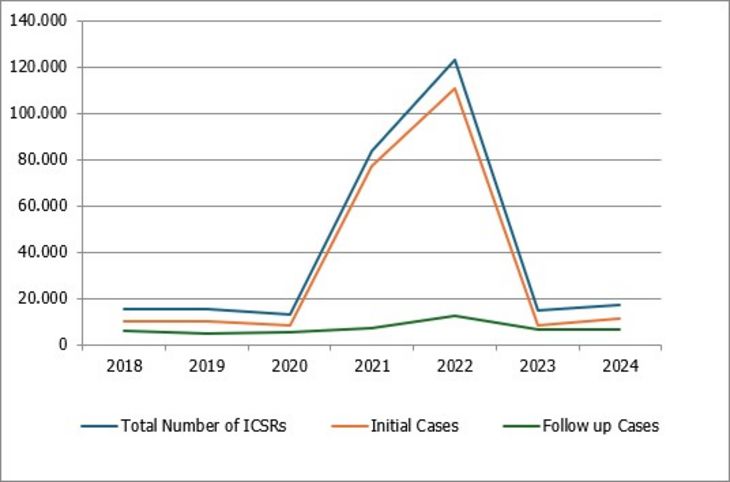
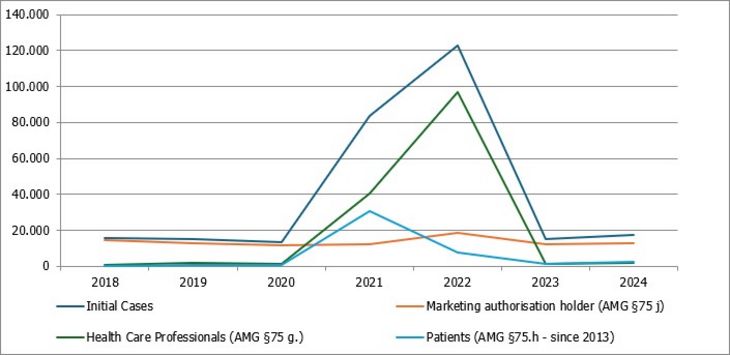
In Austria, the Federal Office for Safety in Health Care (BASG) records all suspected adverse reactions to medicinal products and vaccines that have occurred in Austria and are reported by health professionals or patients. In Austria, patients and their relatives can voluntarily report adverse drug reactions directly to the BASG. Physicians, pharmacists and other health care professionals are legally obliged to report adverse reactions.
https://www.basg.gv.at/en/market-surveillance/reporting/adverse-reactions/nebenwirkungsmeldung-human
After processing and assessment, the data are forwarded to the European Medicines Agency (EMA) in accordance with the applicable European laws and directives. The data are thus available to the national medicines authorities responsible for these marketing authorisations and also to all other European medicines regulatory authorities for ongoing safety monitoring.
In close cooperation with the EU network of authorities, the risk-benefit balance of all approved medicines is monitored on an ongoing basis. The Pharmacovigilance Risk Assessment Committee (PRAC) of the European Medicines Agency (EMA) analyzes all aspects relevant to the safety and efficacy of a vaccine. If necessary, new side effects are added to the summary of product information of the respective vaccine or other measures are set to ensure safe and effective use.


